Writing Protocols with 600A for Permeabilized Tissues
Designing an experiment during the research process is crucial, as it establishes the foundation for generating valid, reliable, and interpretable results. A well-designed experiment ensures that the research question is clearly addressed, appropriate methods are chosen, and biases or confounding variables are minimized.
Nevertheless, a challenging component of designing an experiment can be creating an experimental protocol which will work for your samples. To make this process more efficient and simpler, the 600A Real-Time Muscle Data Acquisition and Analysis System can be utilized to collect muscle mechanics data. The 600A software is a digital controller that allows researchers to precisely synchronize their equipment and record data in real-time. It offers unique capabilities, including controlling force when paired with our high-speed length controller and force transducer, as well as measuring sarcomere length using our high-speed video sarcomere length system.
The protocol editor within the 600A software is the heart of the control system, as it provides a variety of functions in order to generate desired muscle physiology test protocol or experiments. Although the system already includes an extensive library of standardized experimental protocols – which makes the most demanding tests more straightforward – it is also helpful to understand how to create your own protocols and manipulate pre-written ones.
Thus, the purpose of this technical blog is to provide an overview on how to write basic protocols using the 600A software such as specific force, stiffness, kTR, unloaded shortening velocity, and force-pCa measurements.
Jump to:
Opening the Protocol Editor
To open the protocol editor, select “Protocol” and then “Open“. In this window you can create protocols, which control each function based on time.
The four main headings associated with creating a protocol are: Step, Time, Function, and Parameters. Each protocol must contain at least 3 steps (data-enable, data-disable, and stop), but more can be added depending on your research needs. All test protocols are created in order of steps, and each step has a start time, a function, and function parameters.
For more details on navigating the 600A protocol editor page, please refer to the previous blog → Quick Start Guide to 600A.
Specific Force
Understanding the contractile quality and strength of muscle you are testing may be crucial to your study. A common measurement to investigate this is known as specific force (SF), also referred to as tension. To calculate specific force, the maximal isometric force is divided by cross sectional area (CSA) (O’Brien et al., 2010). CSA serves as a representation of the number of sarcomeres arranged in parallel, which are the basic functional units of muscle contraction.
Using our High-Speed Video Sarcomere Length (HVSL) system, one may set and observe the sarcomere length of a fiber. Additionally, CSA can be calculated by measuring the diameter of the fiber.
An example of how to measure fiber diameter is…
- Align the crosshairs of a microscope graticule parallel to the sarcomeres
- Measure the diameter at 3-5 locations along the length of the fiber using a micromanipulator
- Average these values to obtain diameter
Generally, a specific force test is conducted by moving a fiber from relaxing solution, to pre-activating or washing solution, to an activating solution with a high concentration of Ca2+ to chemically activate a fiber. The fiber is given a time to reach plateau (e.g., 20 sec), and is then moved back into relaxing solution. The minimum force produced in relaxing solution is subtracted from the maximum isometric force measured in activating solution, and this value is divided by the fiber’s CSA to provide a specific force value.
Bath changes may be done manually using the 802D bath control program or programmed within the protocol editor of 600A to automate the process.
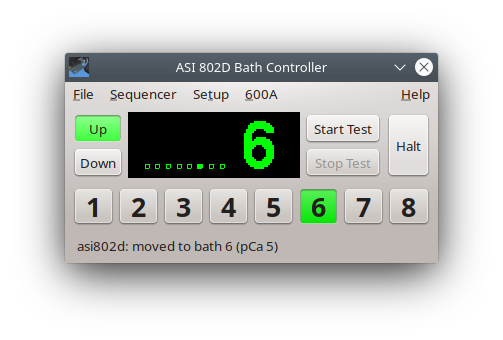
In the video above, the bath plate is being moved from bath 1 to 4 using the 802D Bath Controller. This resource was provided to us from an informational Webinar by PhD candidate Paris Mashouri (University of Guelph).
To write an automated specific force protocol using the 600A software, follow the steps below:
- Step 1: Insert a Bath function. Start with moving the fiber from the bath with relaxing solution (e.g., bath 1) to the bath containing the pre-activating solution (e.g., bath 2)
- Parameters: 2, 0 ms
- Step 2: Insert a Data-Enable function at 25000.0 ms. This will ensure the resting tension of the fiber is collected for 5 sec before the bath is changed into activating solution.
- Step 3: Insert another Bath function at 30000.0 ms. After the fiber has incubated for 30 sec in pre-activating, we insert another bath change into activating solution (Bath 3). The fiber will be kept in this bath for 20 more seconds, so that it may reach a plateau.
- Parameters: 3, 0 ms
- Step 4: Insert another Bath function at 50000.0 ms. The fiber has now been returned to relaxing solution, and will return to its original tension.
- Parameters: 1, 0ms
- Step 5: Insert a Data-Disable function at 51000.0 ms.
- Step 6: Insert a Stop function at 51001.0 ms.
- Step 7: Save your new protocol by clicking “Save As”. This will prompt you to save this file to a desired location on the computer.

Stiffness
Stiffness is a common measurement that is taken in single fiber experiments. This measurement is a proxy for the number of cross-bridges that are tightly vs. weakly bound (Colombini et al., 2005). Additionally, it gives one an indication of the intrinsic mechanisms responsible for passive and active force production. Stiffness increases are due to an increase in cross-bridge formation between actin and myosin in their overlapping regions. As the myofilaments slide past one another, they exist in varying states of being weakly vs. strongly bound depending on the length and if they are in their relaxed or active states.
In relaxed fibers, thin and thick filaments are free to slide past one another and little force is required to stretch the passive elasticity of the fiber. However, in an active state when cross-bridges are formed, a greater force is required to stretch a sarcomere due to the distortion of bound cross-bridges that is required. Thus, an activated fiber is much stiffer than a relaxed fiber.
Stiffness = ΔF/ΔL (change in force/change in length)
The change in force/change in length is normalized → stress/strain
- Stress = ΔF/CSA
- Strain = ΔL/Lo
Example of a protocol:
After placing a fiber into activating solution and force reaching a plateau, small sinusoidal changes in length are applied at 1000 Hz at one end of the fiber. The change in force (normalized to CSA) during the stretch is then divided by the change in length (Ochala & Larsson, 2008).
Therefore, when the fiber is maximally activated, you can observe the number of cross-bridges which are responsible for active force production when the muscle fiber is optimally stretched. This gives one an idea of the muscles “active” properties when it is contracting. With this information, researchers can compare healthy with “pathological” muscle stiffness, for example.

Rate Constant of Force Redevelopment (kTR)
The rate constant of force redevelopment (kTR), also known as the rate of attachment of cross-bridges, has been utilized to assess various factors, such as the level of calcium activation on cross-bridge kinetics (Brenner & Eisenberg, 1986; Campbell, 1997). kTR is dependent on the attachment and detachment rate of actin-myosin cross-bridges during activation.
According to Campbell, 1997, if a muscle group of activated and cycling cross-bridges is shifted from a force-bearing to non-force bearing state, the time it takes for the cross-bridges to reform indicates the cross-bridge kinetics responsible for the transition between non-force bearing and force-bearing states.
To conduct a kTR test, fibers at Lo are rapidly shortened to slack length and then re-stretched rapidly back to Lo. The rapid shortening to slack breaks all the bonds between actin and myosin, and the following re-stretch allows for the further detachment of the cross-bridges that may remain, followed by the redevelopment of force.
Examples of optimal length = 2.5 µm for rats and 2.7 µm for humans
Writing a kTR Protocol
An example of a kTR protocol in a paper by Brenner & Eisenberg, 1986 is as follows:
Fibers can be rapidly shortened with a ramp of 10Lo/s by 15% of Lo and then rapidly (500 Lo/s) re-stretched back to Lo.
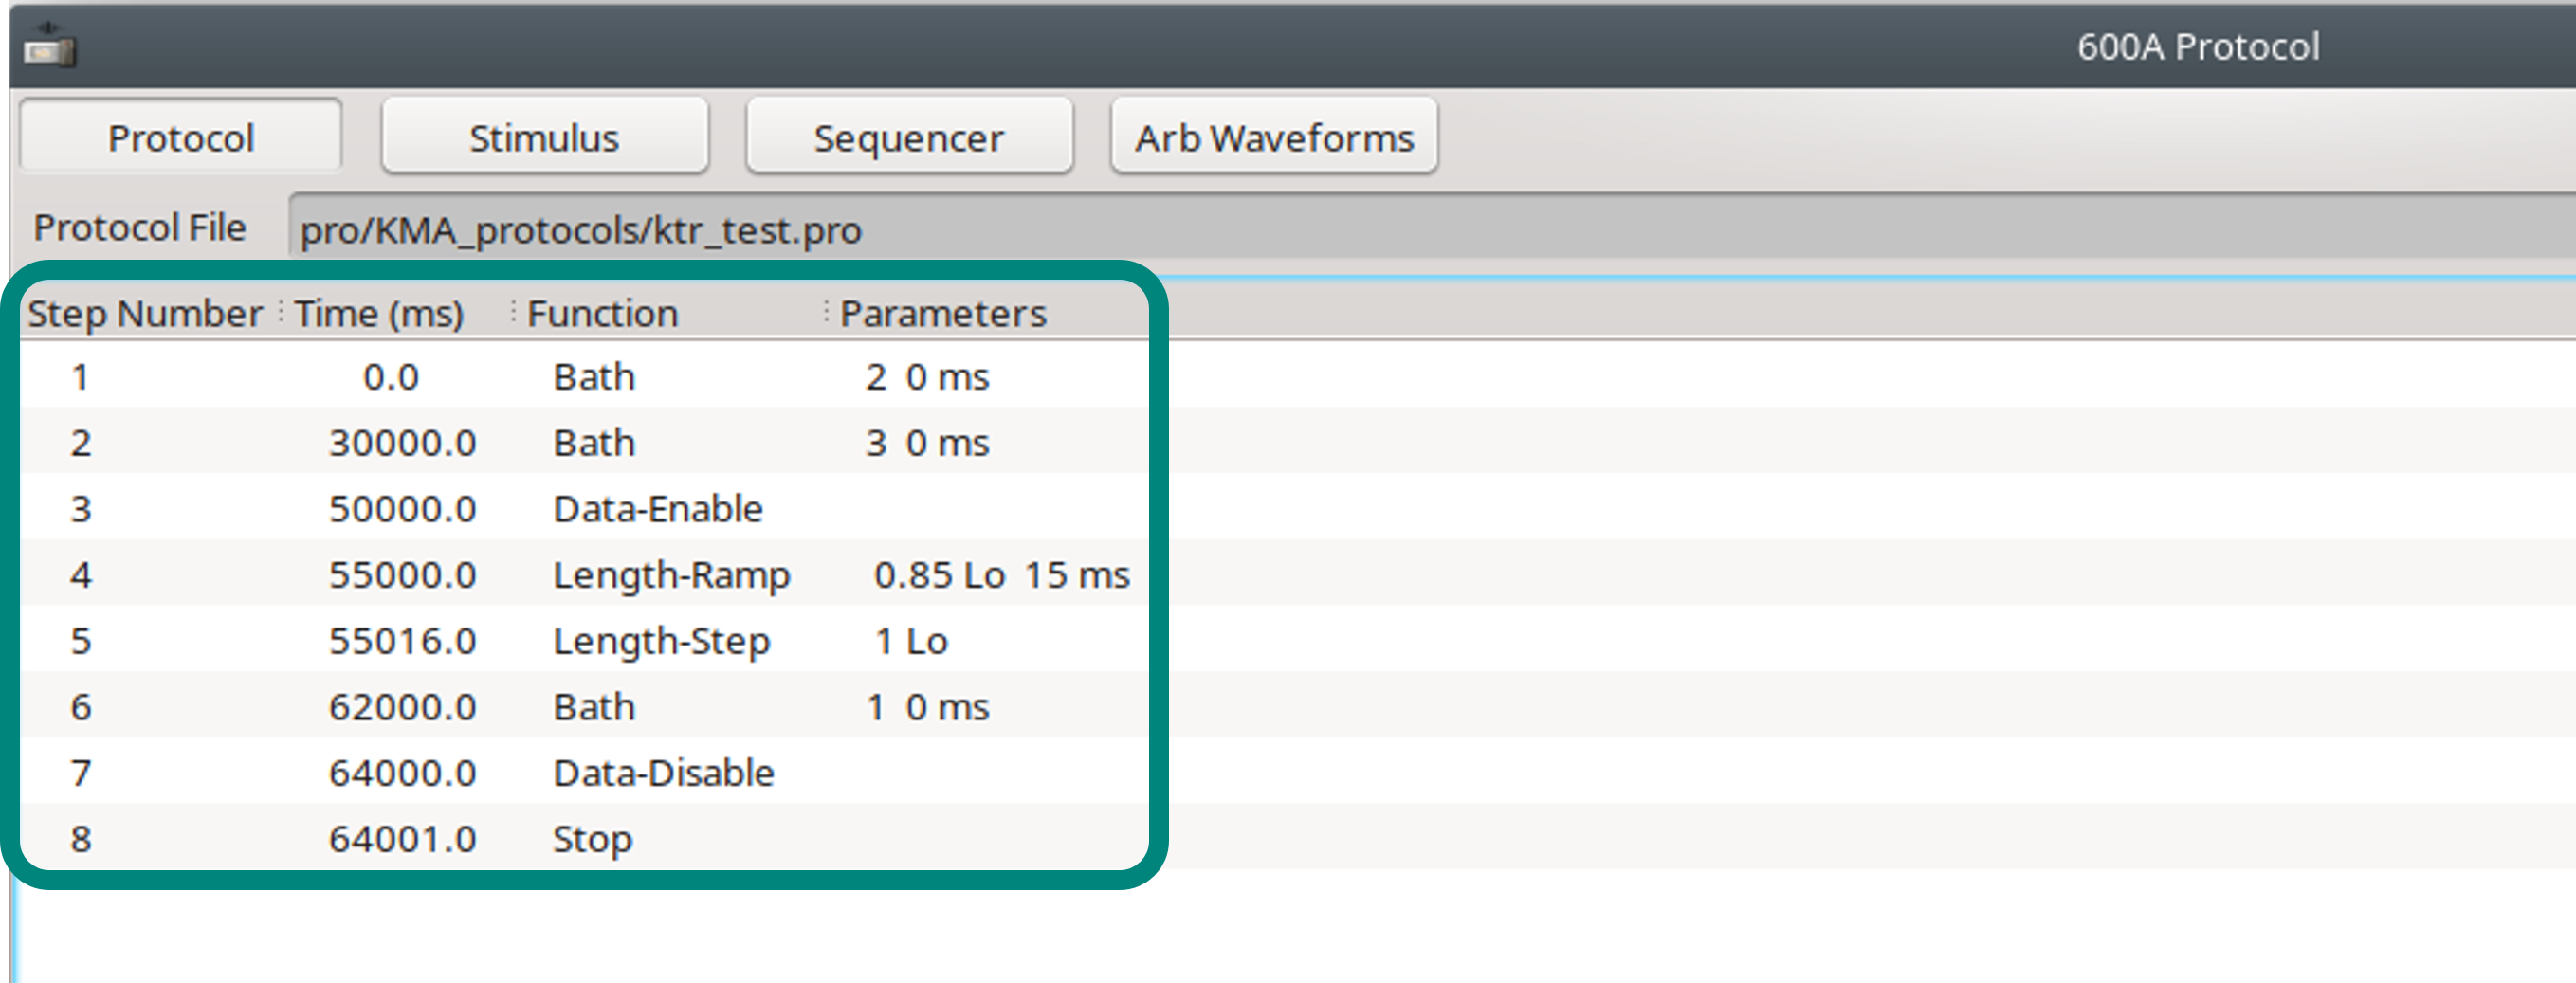
Using 600A Protocol Editor this is written as such:
Step 1: Insert a Bath function at a time of 0 ms. Start with moving the fiber from the bath with relaxing solution (e.g., bath 1) to the bath containing the pre-activating solution (e.g., bath 2).
-
- Parameters: 2, 0 ms
Step 2: Insert a Bath function at a time of 30000.0 ms. Following washing in pre-activating (bath 2), immerse the fiber in the bath with activating solution (e.g., bath 3).
-
- Parameters: 3, 0 ms
Step 3: Insert a Data-Enable function at a time of 50000.0 ms. This will start data collection. This can be done 20000.0 ms following insertion into activating solution to ensure that the fiber’s force has now reached plateau.
Step 4: Insert a Length-Ramp function at a time of 55000.0 ms. Make the parameters 0.85 Lo, and 15 ms. This will make the fiber shorten by 15% of its original length (Lo) at a ramp time of 15 ms.
-
- Parameters: 0.85 Lo, 15 ms
Step 5: Following the 15 ms, insert a Length-step back to Lo. To do this insert a length-step at time 55016.0 ms to a length of 1 Lo.
-
- Parameter: 1 Lo
Step 6: Insert a final Bath function, to move the fiber back to relaxing in bath 1 at 62000.0 ms.
-
- Parameters: 1, 0 ms
Step 7: Insert a Data-Disable function at 64000.0 ms.
Step 8: Insert a Stop function at 64001.0 ms.
Step 9: Save as the desired “File name”.
Unloaded Shortening Velocity (Vo)
Unloaded shortening velocity is the measurement of a fibers ability to maximally shorten at zero load when a fiber is maximally activated (Edman, 1979). This test has also been referred to as the “slack-test” method.
Typically, fibers are permeabilized and subsequently activated in high concentration Ca2+ (e.g., 4.5 pCa) and then is rapidly shortened (e.g., 2 ms) to a predetermined step (e.g., 10, 15, and 20%) of Lo, so that the fiber becomes slack, and the force becomes zero. Following the shortening step, the fiber redevelops force on its own, in proportion to the length it was shortened by, and the velocity at which the fiber shortened at is calculated.
Writing a Vo Protocol
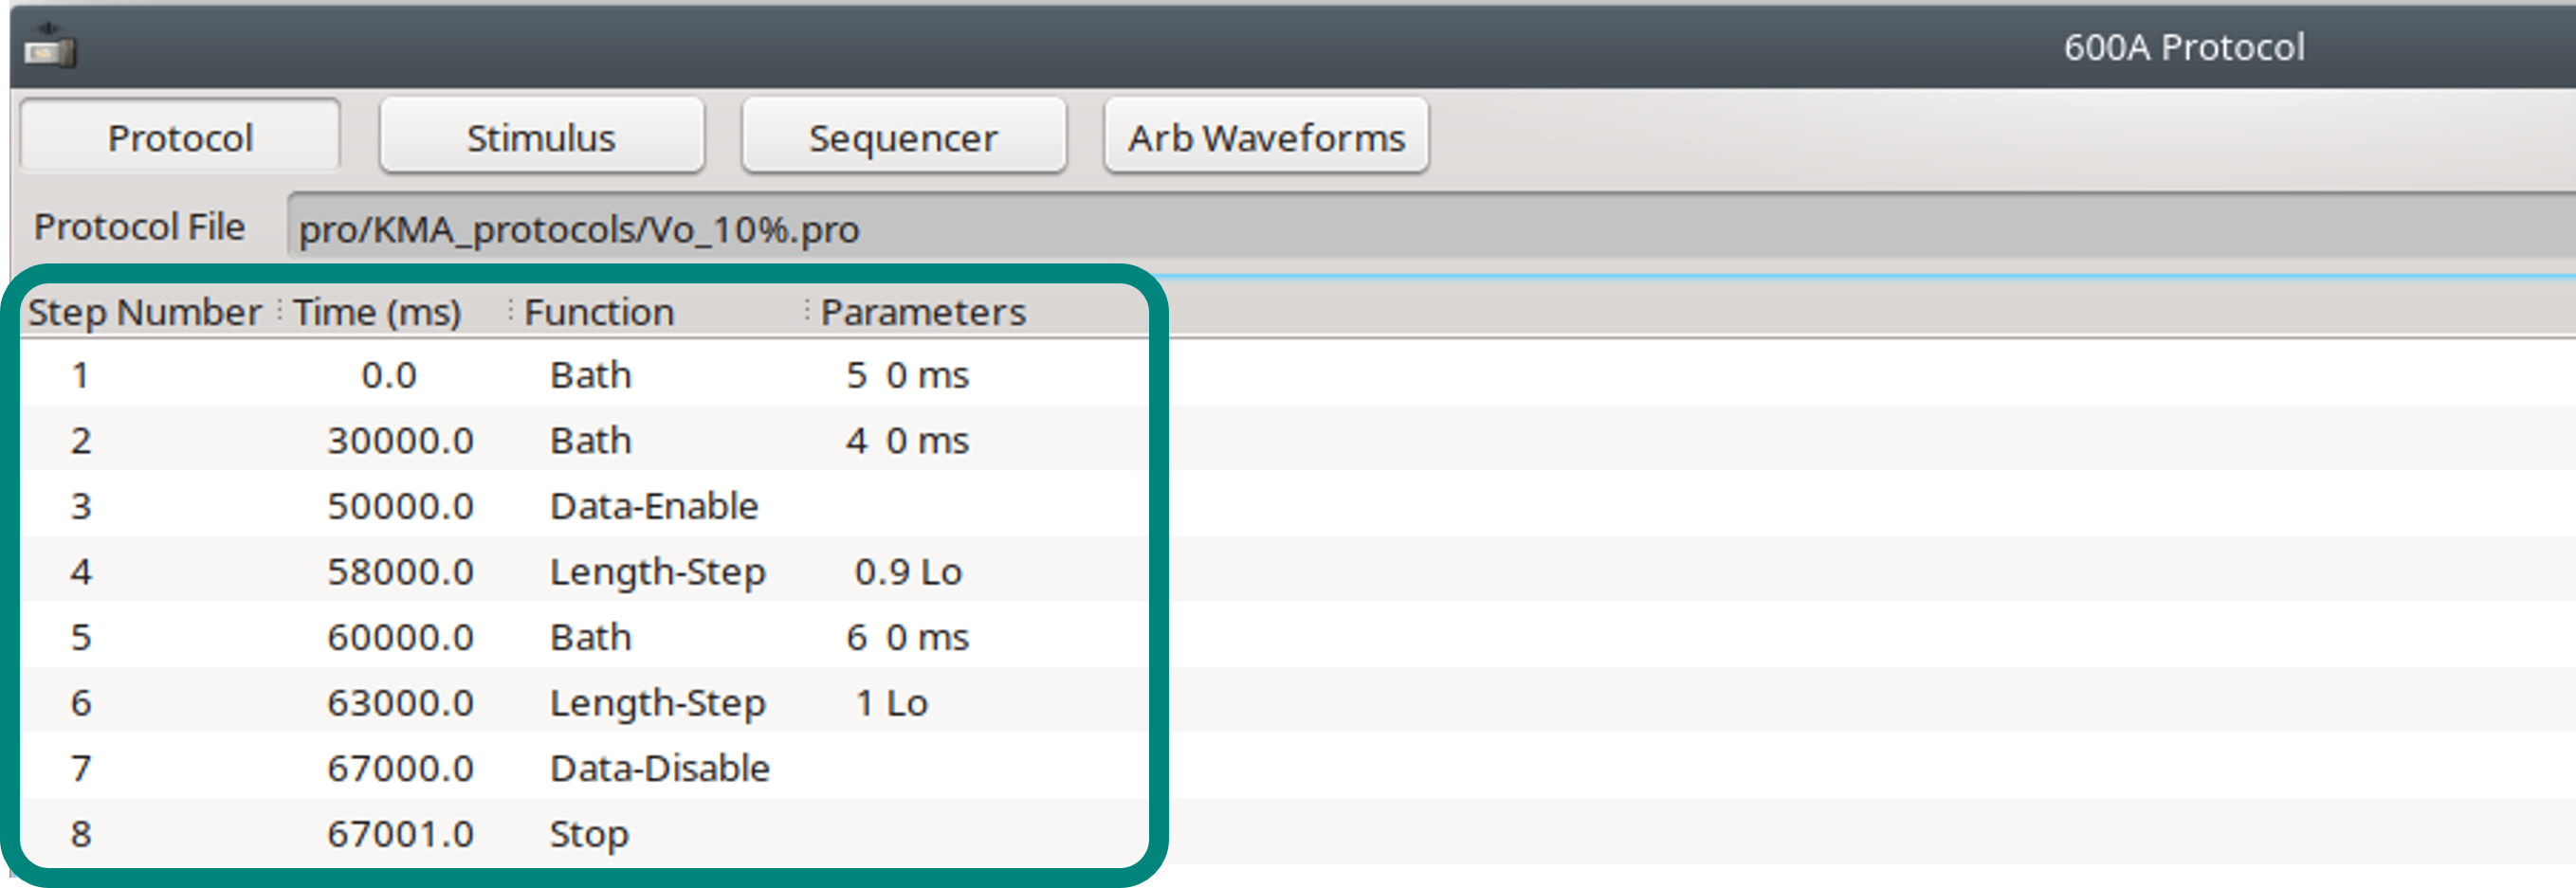
An example Vo protocol with a shortening step of 10% of Lo is written as…
Step 1: Insert a Bath function at a time of 0 ms. Start with moving the fiber from the bath with relaxing solution (e.g., bath 1) to the bath containing the pre-activating solution (e.g., bath 2).
-
- Parameters: 2, 0 ms
Step 2: Insert a Bath function at a time of 30000.0 ms. Following washing in pre-activating (bath 2), immerse the fiber in the bath with activating solution (e.g., bath 3).
-
- Parameters: 3, 0 ms
Step 3: Insert a Data-Enable function at a time of 50000.0 ms. This will start data collection. This can be done 20000.0 ms following being put in activating solution to ensure that the fiber’s force has now reached plateau.
Step 4: Insert a Length-Step function at a time of 58000.0 ms. This will impose a length step. Making this 0.9 Lo (absolute parameter), will shorten the fiber by 10% of its original length.
-
- Parameter: 0.9 Lo
Step 5: Insert a Bath function at a time of 60000.0 ms. Following the shortening step in the activating solution, we are now placing the fiber back into relaxing solution (bath 1).
-
- Parameters: 1, 0 ms
Step 6: Insert a Length-Step function at a time of 63000.0 ms. The fiber is still “slack” sitting in relaxing solution, as the length controller’s position is still 10% closer than it originally was. Thus, we must re-set the position of the length controller by giving the software the command to return back to 1 Lo.
-
- Parameter: 1 Lo
Step 7: Insert a Data-Disable function at a time of 67000.0 ms. This will stop data collection from the software.
Step 8: Insert a Stop function at a time of 67001.0 ms. This step is required to stop the protocol.
Force-pCa
An increase in cytoplasmic Ca2+ concentration is a key step in skeletal muscle contraction. The binding of Ca2+ to troponin C, leading to the conformation change of tropomyosin is imperative for myosin to bind to actin…a cross-bridge is born!
It can be said that calcium concentration is a key factor in the number of myosin heads that are bound to actin, leading to force generation. So, assessing Ca2+ sensitivity, or force-pCa may be of great importance. This is done by observing the force generated by single permeabilized muscle fibers in varying concentrations of Ca2+.
A common variable which is assessed in force-pCa measurements is the value at which 50% of maximal force is reached, known as pCa50. This value is used to understand if there was a shift in the midpoint of the force-pCa to assess Ca2+ sensitivity (MacIntosh, 2003). A rightward shift in pCa50 indicates reduced sensitivity, while a leftward shift reflects greater sensitivity. Additionally, the slope or steepness of a force-pCa curve reflects the cooperativity of calcium binding and activation of the contractile tissue, often quantified by the Hill coefficient. For example, a higher Hill coefficient indicates greater cooperativity.
Writing a force-pCa Protocol
Similar to the specific force protocol, a force-pCa protocol can be done by….
- Manually capturing data by moving the bath via the 802D Bath Controller Program.
OR
- The protocol can be automated, with the bath control function written into the protocol.
Here we will outline how to write an automated force-pCa protocol:
Step 1: Insert a Data-Enable function at 0 ms.
Step 2: Insert a Bath function at a time of 500 ms to bath 2. The fiber will move from bath 1 to bath 2, in this example.
-
- Parameters: 2, 0 ms
Step 3: Insert a Bath function at 10500.0 ms into bath 3, to immerse the fiber in activating solution.
-
- Parameters: 3, 0 ms
Step 4: Insert a Data-Disable function at 40500.0 ms. This will stop data collection.
Step 5: Insert a Bath function at 40600.0 ms to bath 1. Following the data collection, we are placing the fiber back in relaxing solution.
-
- Parameters: 1, 0 ms
Step 6: Insert a Stop function at 40601.0 ms, to finish the protocol.

.
Starting a Test
Before starting a test, you will need to open the protocol window. Click “Load” at the bottom of this window to choose from the protocols that have been pre-loaded on the computer.
As an example, let’s load a stiffness protocol Stiffness_0.3%.pro protocol we have just written.
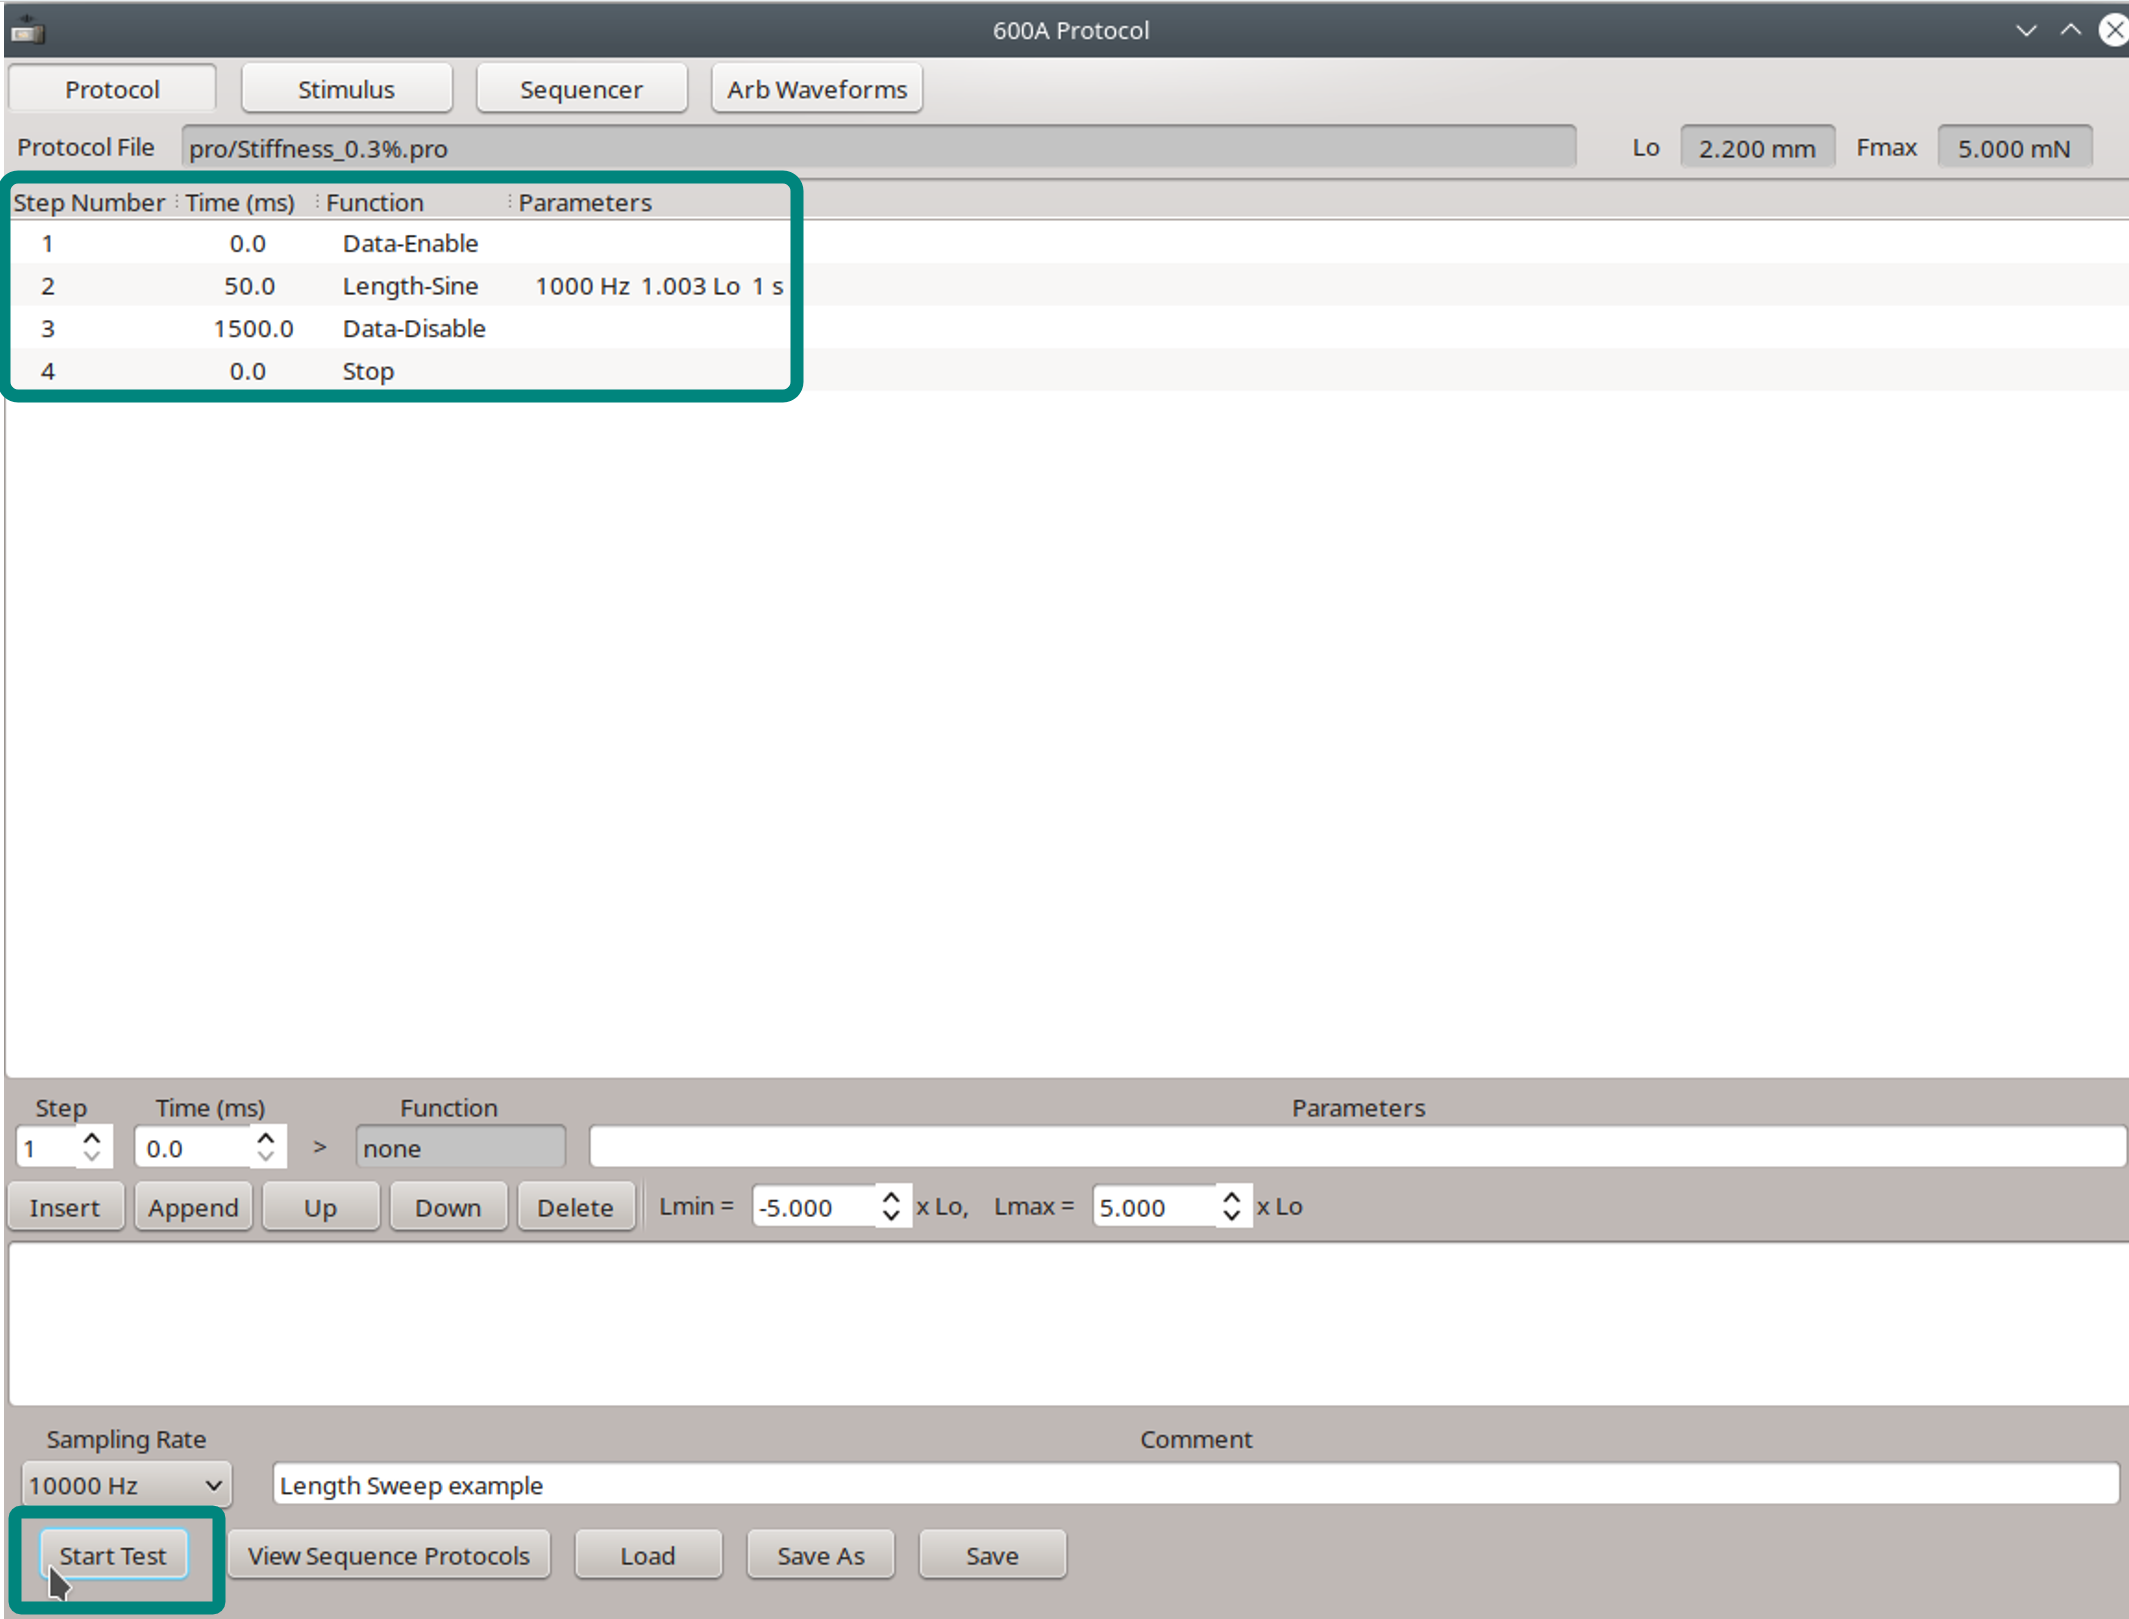
Following the loading of a protocol, press the “Start Test” button at the bottom of the screen on either the main window or the protocol window.
The results of the test will show up on the main screen as soon as the protocol is finished. The graph that is visible is how the data is recorded and will be saved. If the protocol includes a “Repeat” function, then the results for each execution will be plotted immediately. If there is more than one pair of “Data-Enable” or “Data-Disable” functions, then each Data-Enable function will generate a new Frame.
Once the protocol is done, it can be saved to the desired folder by pressing “File” ⇒ “Save Data“.
Resources
Each of these relationships and associated protocols are fundamental for studying muscle physiology and understanding how various factors influence muscle performance, fatigue, and disease states.
For more resources please see below:
For more detailed tip and tricks for starting to use 600A, check out the Quick Start Guide to 600A.
Check out our blog on Tips and Tricks for using the 1400A Permeabilized Fiber System to assist you in improving the quality of your measurements and increase experimental throughput when testing single fibers.
You can also check out our blog on Parameters to Setup in ASI600A Digital Controller Before Starting an Experiment, which is a step-by-step guide to setting up your high-speed length controller before commencing an experiment.
