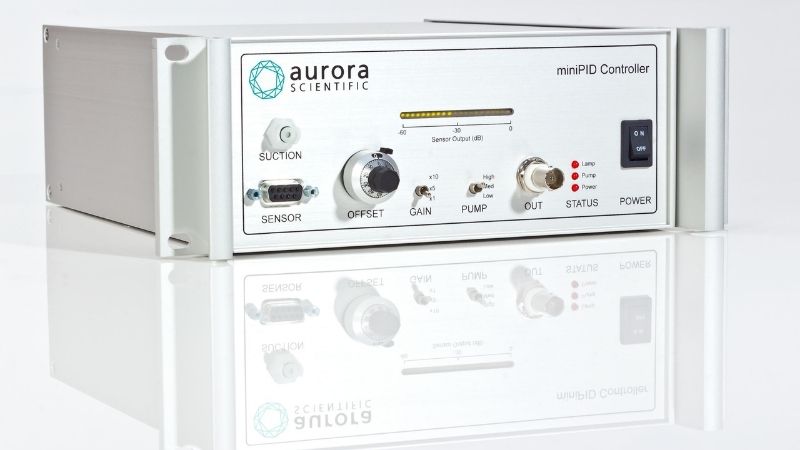
The 200B miniPID is a fast response gas sensor commonly used in olfaction research as a validation tool to ensure a repeatable odor profile is being delivered to the animal or subject; usually via an olfactometer. To ensure the sensor accuracy remains high, it’s important to calibrate after 30-40 hours of operation. Since these experiments involve multiple odors, time courses and the like, calibration can be altered by lamp output, detection cell cleanliness and pump flow rate. Furthermore, cleaning or replacement of the UV lamp can affect output and thus calibration is required whenever this maintenance is performed to ensure reliable output of the miniPID sensor.
In this blog, we will cover in detail one of the calibration techniques using simple gas mixing with a flow rotameter system.
Industrial gas suppliers such as Linde can provide high-pressure cylinders containing calibrated mixtures of tracer gas and air (Figure 1). At the factory we utilize a cylinder of clean ‘zero’ air along with a cylinder of 10ppm, 100ppm and 1000ppm propylene for calibration purposes. A simple gas proportioning rotameter system (Figure 5) can then be used to mix clean air with one of the tracer gas concentrations to create multiple concentration data points for the purpose of calibrating the miniPID sensor. Aurora Scientific supplies these manual rotameter calibration kits (205A) for this purpose.
S
P
A
C
E
Figure 1. Pre-calibrated cylinders of zero clean air, 10ppm, 100ppm and 1000ppm propylene.

Once your tracer gas and calibration system are in place, the first step of calibration is to measure pump flow rate of the miniPID, in this case we use a Matheson flowmeter (Figure 2, right side) hooked up to the PID inlet needle (Figure 2, left side). Turn the miniPID controller on and set the pump to low, measure the flow rate by visualizing the bubble on the flowmeter. Once you have that value, enter the flow into the calibration sheet provided with your unit (Figure 7) and locate the corresponding flowrate in sccm with the Matheson Flowmeter tab. Repeat this process at each pump setting (Medium and High).


Figure 2. Left: miniPID sensor head with inlet needle connected to flowmeter tubing. Right: Flowmeter used to measure flow rate of miniPID pump.
After determining the flow rate for each pump speed, leave the pump on high for the remainder of the calibration.
Next, we will measure the maximum output of the lamp at 100ppm of tracer gas, in our case Propylene. Open the lid of the controller box and locate the potentiometer PT1 (lamp run voltage potentiometer) and TP1 (test point). Connect an oscilloscope or other voltage recording device to TP1 and a multimeter/voltmeter to the signal output BNC on the front of the controller. Using the rotameter (Figure 6), deliver 100ppm of propylene (100% 100ppm cylinder) to the miniPID inlet needle at a flow rate higher than the value found previously for the ‘High’ pump speed. Observe the voltage at TP1 on your oscilloscope and look for the stable voltage signal following the peak (Figure 3, yellow line) which corresponds to the lamp run voltage. Measure this value (i.e. 5V) and then using a flat-head screwdriver dial back PT1 3 turns (roughly 0.5V) to ensure stability of lamp output. Enter this measured value into the calibration sheet if needed under “RF Run” (i.e. 4.5V).

Figure 3. Oscilloscope display showing the typical lamp run voltage signal plot.
Once that is found, measure the output signal using a multimeter or voltmeter. This value should be approximately 2V for 100pm of tracer gas, if slightly higher or lower, adjust the output using the offset to get a stable reading.
After the lamp run voltage has been found, switch the rotameter to deliver 0ppm clean air to adjust the zero voltage with a voltmeter or multimeter connected to the signal output. This output should be as close to 0V as possible, to adjust, find the use “Zero” potentiometer inside the controller such that the output has a small offset of 100mV. This is to prevent the miniPID from reading offscale at low concentrations. Confirm that your zero air reading is near 0V output at all 3 gain settings.. The logarithmic LED scale is an easy way to visualize 100mV of signal as it equals 1 LED (Figure 4). Record this value at each gain and enter them into calibration sheet (Figure 7).

Figure 4. Front panel of miniPID controller showing 100mV baseline signal is equivalent to 1 LED.
Once the miniPID zero is set, you can now begin to calibrate the sensor using a rotameter (Figure 5) or some other form of calibration (i.e. MFCs, etc.). Here, we will use the rotameter to mix propylene with clean air to produce propylene concentrations of 5, 10, 50, 100 and 500ppm. For 5ppm, mix clean air and 10ppm propylene (or your calibration gas of choice) at a 1:1 ratio.

Figure 5. Aurora Scientific 205A gas sensor calibrator.
Ensure the total flow rate entering the miniPID is slightly higher (approximately 10%) than the flow rate at the ‘High’ pump speed. For example, notice the flow of air (65) and propylene (65) in Figure 6 (Red arrows) summate to 130 and the highest pump speed flowrate was measured in this example as 120 on the flowmeter.
Measure the output for 5ppm at Gain 1x, 5x and 10x and enter these values in the calibration sheet.
S
P
A
C
E
R
S
Figure 6. Matheson flowmeters showing equal flow rate of clean air and tracer gas during calibration.

Repeat the mixing process for the remaining concentrations at each gain as follows:
- 10ppm; 100% 10ppm propylene
- 50ppm; 50/50 clean air and 100pm propylene
- 100ppm; 100% 100ppm propylene
- 500ppm, 50/50 clean air and 1000ppm propylene

Figure 7. Calibration Sheet filled with measured values found during the calibration process.
Once all the values have been entered into the calibration sheet above for each gain setting, you can then plot them (Figure 8) to ensure the signal output is linear across each concentration and at each gain setting.

Figure 8. miniPID calibration plot using the measured values in the Calibration sheet at each Gain.
For other useful resources pertaining to the 200B miniPID and other olfaction products, check out our blog or FAQs as well as recent publications.